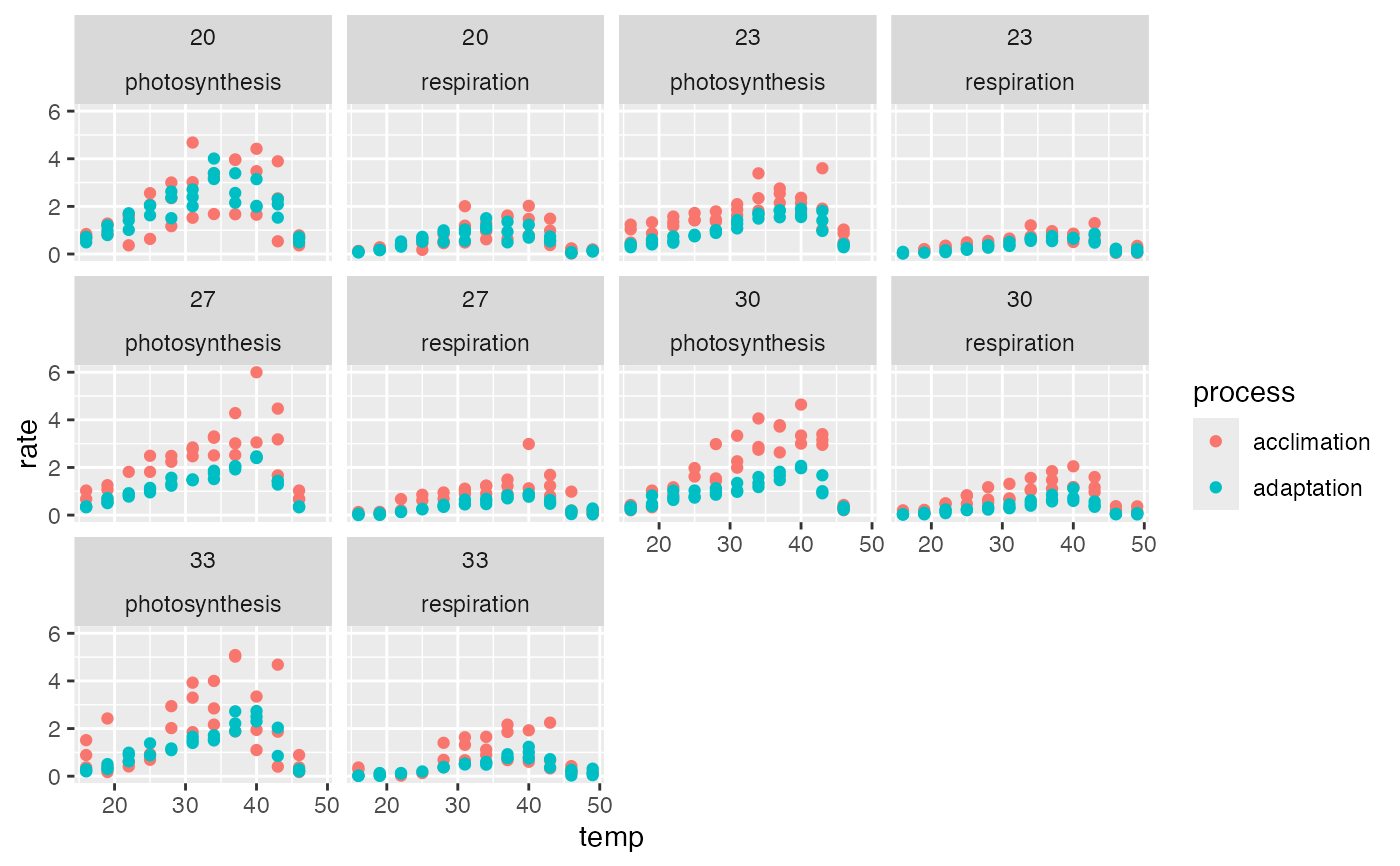
A dataset containing example data of rates of photosynthesis and respiration of the phytoplankton Chlorella vulgaris. Instantaneous rates of metabolism were made across a range of assay temperatures to incorporate the entire thermal performance of the populations. The dataset is the cleaned version so some datapoints have been omitted.
Usage
data("chlorella_tpc")Format
A data frame with 649 rows and 7 variables:
- curve_id
a unique value for each separate curve
- growth_temp
the growth temperature that the culture was maintained at before measurements were taken (degrees centigrade)
- process
whether the cultures had been kept for a long time at their growth temperature (adaptation/~100 generations) or a short time (a measure of acclimation/~10 generations)
- flux
whether the curve depicts respiration or gross photosynthesis
- temp
the assay temperature at which the metabolic rate was measured (degrees centigrade)
- rate
the metabolic rate measured (micro mol O2 micro gram C-1 hr-1)
References
Padfield, D., Yvon-durocher, G., Buckling, A., Jennings, S. & Yvon-durocher, G. (2015). Rapid evolution of metabolic traits explains thermal adaptation in phytoplankton, Ecology Letters, 19, 133-142.
Examples
data("chlorella_tpc")
library(ggplot2)
ggplot(chlorella_tpc) +
 geom_point(aes(temp, rate, col = process)) +
 facet_wrap(~ growth_temp + flux)

